


If you’re new to the world of trading and investing, you may have heard the term “technical analysis” thrown around. But what exactly is technical analysis, and how can it help you make informed decisions in the market?
In this beginner’s guide, we’ll explore the basics of technical analysis, including what it is, how it works, and some common patterns and indicators to look out for.
What Does Technical Analysis Entail?
Technical analysis (TA), also commonly referred to as charting, constitutes a specific method of analysis with the primary objective of predicting future market behavior. It achieves this by scrutinizing historical price action and volume data. This analytical approach is widely deployed in the realm of traditional financial markets, predominantly concerning stocks and other assets. However, it has also firmly established itself as an indispensable component for trading digital currencies within the dynamic cryptocurrency market.
In stark contrast to fundamental analysis (FA), which takes into account a myriad of factors influencing an asset’s price, TA maintains an unwavering focus on the historical performance of prices. As such, it serves as a pivotal instrument for dissecting an asset’s price fluctuations and volume data, with numerous traders harnessing its power to discern trends and identify lucrative trading prospects.
While the early incarnations of technical analysis surfaced in 17th-century Amsterdam and 18th-century Japan, contemporary TA owes much of its development to the pioneering work of Charles Dow. Dow, a prominent financial journalist and the founder of The Wall Street Journal stands among the first individuals to recognize the existence of discernible trends in the movements of individual assets and markets. His groundbreaking work ultimately gave rise to the Dow Theory, which, in turn, catalyzed further advancements in the field of technical analysis.
In its nascent stages, the rudimentary practice of technical analysis relied on manual calculations and handcrafted charts. However, with the relentless progress of technology and the advent of modern computing, TA experienced widespread adoption and evolved into an indispensable tool for a multitude of investors and traders.
What Is the Functioning Principle of Technical Analysis?
As previously mentioned, Technical Analysis (TA) primarily involves the in-depth examination of an asset’s historical and current price movements. The fundamental premise underlying technical analysis posits that price fluctuations of an asset follow discernible trends over time rather than occurring randomly.
At its essence, TA delves into the analysis of market dynamics driven by the interplay of supply and demand, which serves as a mirror of the broader sentiment prevailing in the market. In simpler terms, an asset’s price reflects the counterbalancing forces of buying and selling, intricately tied to the emotional aspects of traders and investors, notably fear and greed.
It is worth noting that Technical Analysis is considered to be more dependable and efficacious in markets that function under regular conditions, characterized by substantial trading volumes and ample liquidity. High-volume markets exhibit lower vulnerability to price manipulation and extraordinary external factors that might otherwise generate misleading signals, rendering technical analysis ineffective.
To scrutinize price movements and identify favorable trading opportunities, traders make use of various charting tools, commonly referred to as indicators. These technical analysis indicators not only assist traders in recognizing existing trends but also offer valuable insights into potential future trends. Given that TA indicators are not infallible, some traders opt to employ multiple indicators as a strategy to mitigate risks.
Typical Technical Analysis Indicators
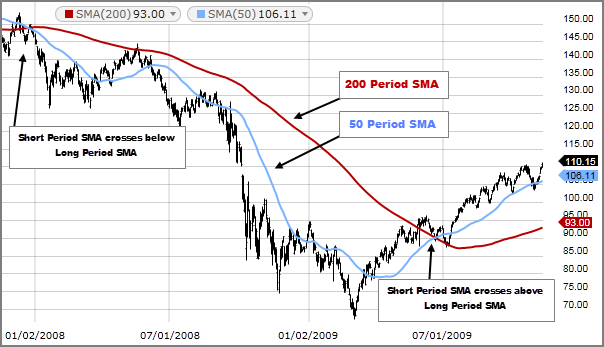
Usually, traders who engage in technical analysis (TA) make use of a diverse array of indicators and metrics to ascertain prevailing market trends by scrutinizing charts and historical price movements. Among the myriad technical analysis indicators, simple moving averages (SMA) serve as one of the most frequently employed and widely recognized examples. As the name implies, the SMA is computed based on the closing prices of an asset within a predetermined time frame. The exponential moving average (EMA), on the other hand, is a modified iteration of the SMA that assigns greater weight to recent closing prices than to older ones.
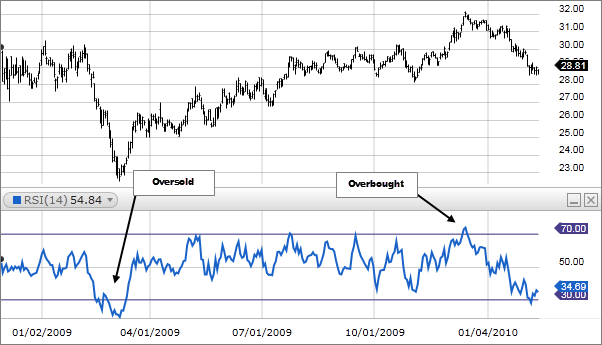
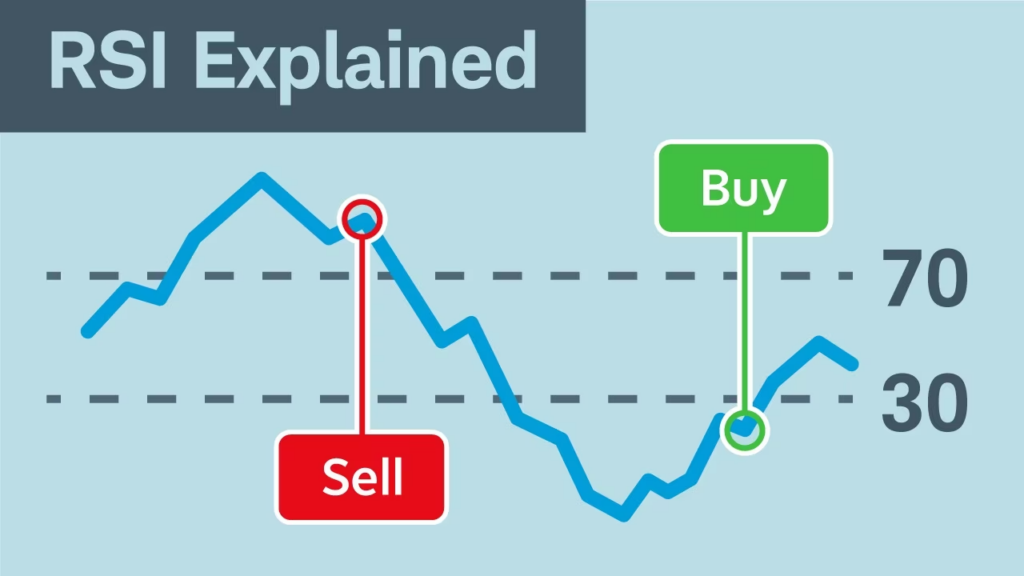
Another indicator commonly utilized is the relative strength index (RSI), which belongs to the category of indicators known as oscillators. Unlike simple moving averages, which merely track price fluctuations over time, oscillators employ mathematical formulas on pricing data, producing readings that fall within predefined ranges. In the case of the RSI, this range extends from 0 to 100.
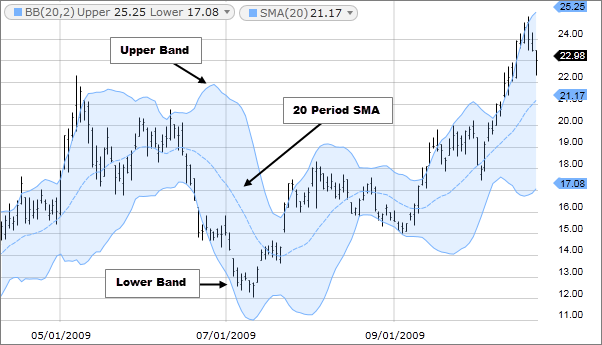
The Bollinger Bands (BB) indicator, another oscillator-type tool, is quite favored among traders. The BB indicator comprises two lateral bands that encompass a moving average line. It is employed to identify potential overbought and oversold market conditions, as well as to gauge market volatility.
In addition to the fundamental and straightforward TA instruments, there exist indicators that rely on other indicators to generate data. For instance, the Stochastic RSI is derived by applying a mathematical formula to the regular RSI. Another prominent example is the moving average convergence divergence (MACD) indicator. The MACD is created by subtracting two EMAs to establish the primary line (the MACD line). The first line is then utilized to calculate another EMA, yielding a secondary line, known as the signal line. Furthermore, there is the MACD histogram, which is computed based on the disparities between these two lines.
Trading Signals
While indicators serve a valuable purpose in identifying broad trends, they also serve the purpose of imparting insights into potential points at which one might consider entering or exiting a market (commonly referred to as buy or sell signals). Such signals tend to materialize when specific events manifest themselves within an indicator’s chart. For instance, in the case of the Relative Strength Index (RSI), a reading of 70 or higher may indicate that the market is currently operating in an overbought state. Likewise, when the RSI falls to 30 or below, it is often viewed as a sign that the market is experiencing oversold conditions.
As mentioned earlier, it’s worth noting that trading signals provided by technical analysis are not infallible and are subject to a considerable amount of noise, resulting in false signals emanating from these indicators. This issue becomes particularly pertinent in the context of cryptocurrency markets, which are comparatively smaller and consequently more susceptible to volatility, as opposed to their traditional counterparts.
Criticisms
Although widely employed across various markets, technical analysis (TA) is viewed skeptically by numerous experts, who regard it as a contentious and often untrustworthy approach, often dubbing it a “self-fulfilling prophecy.” This term characterizes occurrences that transpire solely due to a significant number of individuals assuming their occurrence.
Detractors posit that, within the sphere of financial markets, should a substantial cohort of traders and investors place their faith in identical indicators, such as support or resistance lines, the likelihood of these indicators yielding results is heightened.
Conversely, staunch advocates of TA contend that every chartist employs a distinctive method for chart analysis and harnessing the numerous available indicators. This suggests that it is nearly unfeasible for a multitude of traders to adopt the same unique strategy.
Comparison Between Fundamental Analysis and Technical Analysis
One fundamental tenet underpinning technical analysis is the belief that market prices already encompass all relevant fundamental factors pertaining to a specific asset. In contrast to the approach of technical analysis, which predominantly fixates on historical price data and trading volume, fundamental analysis (FA) follows a more comprehensive investigative strategy that places a greater emphasis on qualitative aspects.
Fundamental analysis holds the viewpoint that the future performance of an asset depends on a multitude of factors beyond mere historical data. Essentially, FA serves as a method used to assess the intrinsic value of a company, business, or asset, grounded in a diverse array of micro and macroeconomic conditions, including aspects such as company management, reputation, market competition, growth rates, and industry dynamics.
Consequently, it can be observed that dissimilar to technical analysis, which primarily serves as a tool for forecasting price movements and market conduct, fundamental analysis functions as a means to ascertain whether an asset is overvalued or undervalued, taking into account its context and potential. While technical analysis predominantly finds favor with short-term traders, fundamental analysis tends to be the preference of fund managers and long-term investors.
One salient advantage of technical analysis lies in its reliance on quantitative data. Therefore, it furnishes a structured framework for an objective examination of price history, mitigating some of the speculative elements that are inherent in the more qualitative approach of fundamental analysis.
Nevertheless, even when dealing with empirical data, technical analysis is not immune to personal bias and subjectivity. For instance, a trader with a strong predisposition toward a particular conclusion about an asset may manipulate their technical analysis tools to bolster their bias and align with their preconceived notions, often doing so unknowingly. Furthermore, technical analysis can falter during periods in which the markets do not exhibit a discernible pattern or trend.
Conclusion
In light of the ongoing criticisms and the enduring, contentious debate surrounding the superiority of one approach over the other, many experts view a prudent choice as combining elements from both Technical Analysis (TA) and Fundamental Analysis (FA). Typically, FA primarily pertains to long-term investment strategies, whereas TA can offer valuable insights into short-term market conditions, thereby proving beneficial to both traders and investors. This can be especially advantageous when seeking to identify opportune moments for making entry and exit decisions, for instance.